ElsiumAI 0.9.0: Dev Studio, AI Proxy, Structured Extraction, and Enterprise Audit
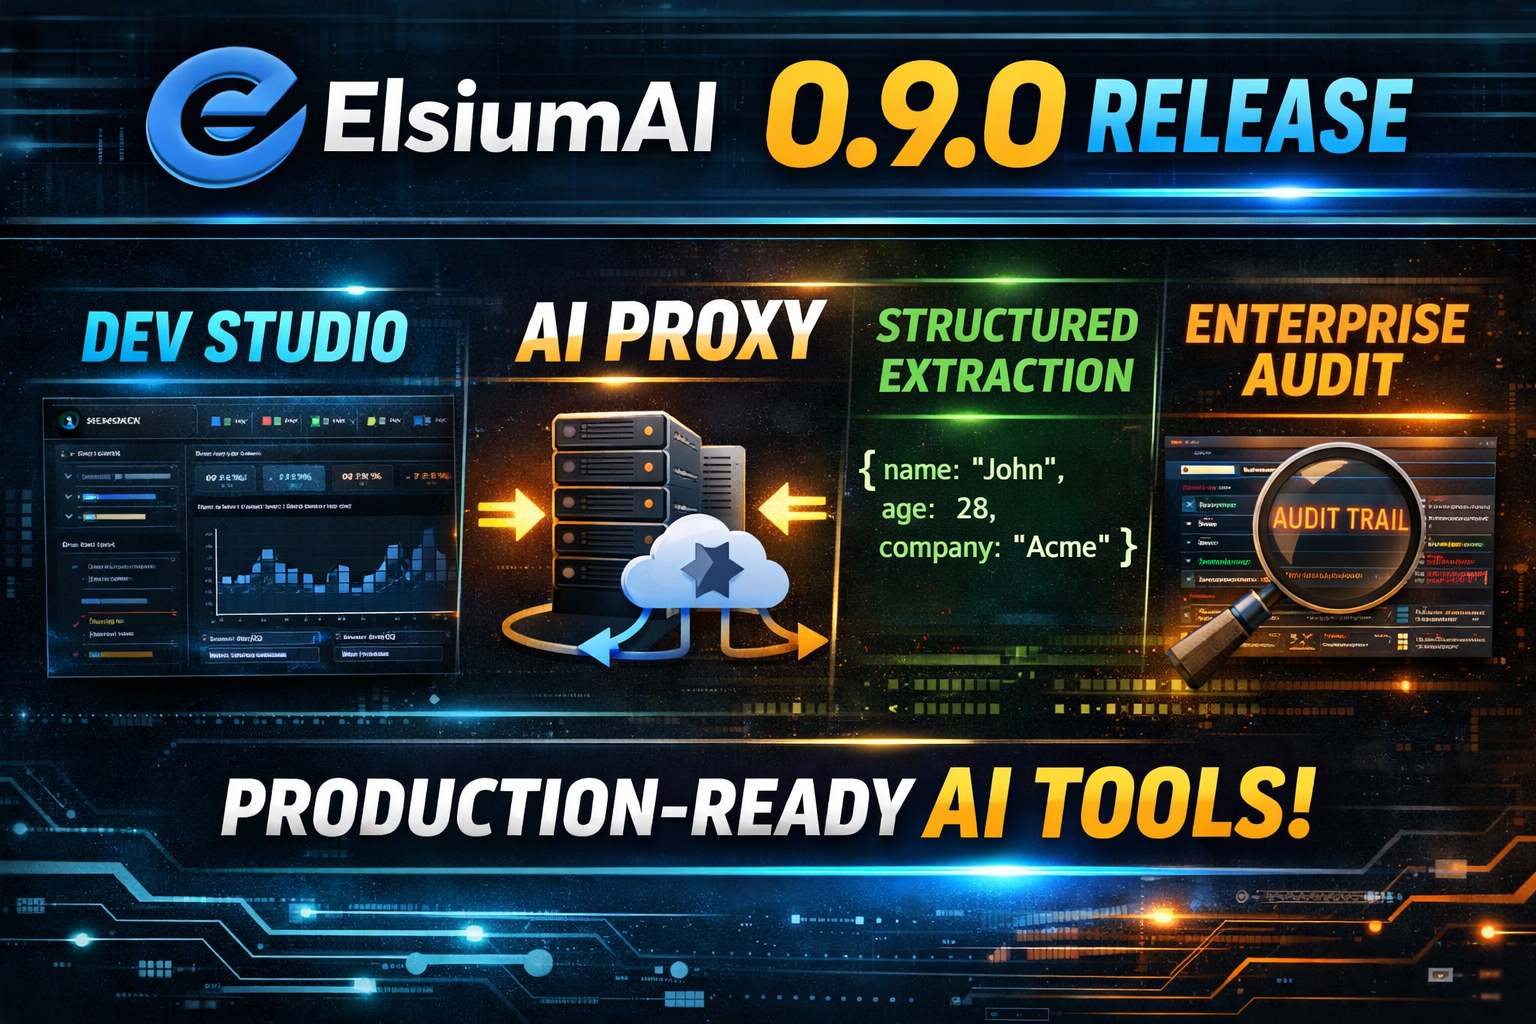
We just shipped the biggest release of ElsiumAI yet. Four new capabilities that close the gap between “I built an AI prototype” and “I can trust this in production.”
Here’s what’s new and why it matters.
1. Structured Extraction — One Line, Typed Output
Every production AI app eventually needs to extract structured data from text. Parse a resume. Classify a support ticket. Pull entities from a document.
Before, this meant writing JSON prompts, parsing responses, handling validation failures, retrying manually. Now it’s one line:
import { gateway } from '@elsium-ai/gateway'
import { z } from 'zod'

const llm = gateway({ provider: 'anthropic', apiKey: env('ANTHROPIC_API_KEY') })

const UserProfile = z.object({
  name: z.string(),
  age: z.number(),
  company: z.string(),
})

const user = await llm.extract(UserProfile, 'Extract from: John, 28, engineer at Acme')
// { name: 'John', age: 28, company: 'Acme' } — fully typed
Define a Zod schema. Pass it with your text. Get a typed result back.
If the LLM returns invalid output (wrong types, missing fields), extract() feeds the Zod error back to the model and retries — up to 3 times by default. You never see the invalid intermediate outputs. You either get a valid, typed result or a clear error.
This works across all providers. Anthropic uses tool-based extraction. OpenAI uses json_schema mode. Google uses responseSchema. ElsiumAI picks the right approach per provider automatically.
2. Dev Studio — Your Free, Local LangSmith
LangSmith charges $400/month to show you what your AI system is doing. We ship the same thing for free, running on your machine.
elsium studioOpen http://localhost:4567 and you get a dark-themed web dashboard with four tabs:
Traces — Every span your system produces. Click to expand the span tree and see metadata, events, timing. See which operations are slow, which are failing, how they nest.
Requests (X-Ray) — Every LLM call with full detail. Provider, model, latency, tokens, cost. Color-coded by provider so you can spot patterns. Click to see the exact request and response (redacted for safety).
Costs — Summary cards showing total spend, total tokens, total calls. Bar chart breakdown by model. See at a glance where your money is going and whether that $3/day habit is actually a $300/day problem.
Live — Real-time event stream. As your app runs, events appear in the dashboard instantly. No polling, no refresh — Server-Sent Events push updates the moment a file changes.
How to wire it up
Add the Studio Exporter to your app:
import { observe, createStudioExporter } from '@elsium-ai/observe'

const studio = createStudioExporter()
const tracer = observe({ output: [studio] })

// After each LLM call:
studio.writeCostReport(tracer.getCostReport())

const lastCall = llm.lastCall()
if (lastCall) {
  studio.writeXRayEntry(lastCall)
}
Then run two terminals side by side:
# Terminal 1: your app
elsium dev

# Terminal 2: the dashboard
elsium studio
Your app writes to .elsium/. The Studio watches that directory and updates in real time. No accounts, no API keys, no cloud dependency. Your data never leaves your machine.
3. AI Proxy — Zero-Code Observability for Any Language
Not everyone writes TypeScript. But everyone deserves cost tracking, caching, and audit trails.
The AI Proxy is a standalone HTTP server that sits between your app and LLM providers. It implements the OpenAI API format, so any app that calls OpenAI can use it with zero code changes:
elsium proxy --port 4000 --budget 50 --audit --cacheThen point your app to it:
# Python
export OPENAI_BASE_URL=http://localhost:4000/v1
python my_app.py

# Go
os.Setenv("OPENAI_BASE_URL", "http://localhost:4000/v1")

# Any language
curl http://localhost:4000/v1/chat/completions \
  -H "Authorization: Bearer $OPENAI_API_KEY" \
  -d '{"model": "gpt-4o", "messages": [{"role": "user", "content": "Hello"}]}'
The proxy automatically detects the provider from the model name (claude-* → Anthropic, gpt-* → OpenAI, gemini-* → Google) and forwards the request with ElsiumAI middleware applied.
What you get for free:
- Cost tracking —
GET /statsshows total spend, tokens, and breakdown by model - Budget enforcement — Set
--budget 50and the proxy rejects requests after $50 - Response caching —
--cachededuplicates identical requests - Audit trail —
--auditenables SHA-256 hash-chained event logging - Request logging — Every call logged with provider, model, latency, tokens
This is the lowest-friction way to try ElsiumAI. Start the proxy, point your existing app at it, and immediately see where your money is going.
4. Eval Datasets & Regression Detection
Evals are the tests of AI systems. But most frameworks treat them as an afterthought — “write a script, run it manually, eyeball the results.”
ElsiumAI 0.9.0 ships first-class eval infrastructure:
Load datasets from files
import { loadDataset, runEvalSuite } from '@elsium-ai/testing'

// Supports JSON, CSV, and JSONL
const dataset = await loadDataset('./data/test-cases.csv')

const result = await runEvalSuite({
  name: 'quality-check',
  cases: dataset.cases,
  runner: async (input) => myAgent.run(input),
})
Save baselines and catch regressions
# Save current results as the baseline
elsium eval ./evals/suite.ts --save-baseline

# Later: compare against baseline
elsium eval ./evals/suite.ts --compare quality-check
The comparison shows you exactly what changed: which cases regressed, which improved, and the overall score delta. If any previously-passing case now fails, the command exits with code 1 — so you can gate CI on it.
Load external datasets
elsium eval ./evals/suite.ts --dataset ./data/production-samples.jsonSeparate your eval logic from your test data. Pull cases from production logs, customer reports, or hand-curated datasets. The eval runner doesn’t care where the cases come from.
5. Enterprise Audit Trail Upgrades
The audit system that was already in ElsiumAI got significantly more capable:
Audit Sinks — Export events to external systems. Ship with three built-in sinks: generic webhooks, Splunk HEC, and Datadog Log Intake v2. Implement the AuditSink interface for Kafka, ELK, or anything else.
Per-Sink Filtering — Route security events to your SIEM, cost events to your dashboard, everything to your archive:
const audit = createAuditTrail({
  sinks: [
    {
      ...createSplunkSink({ url: splunkUrl, token }),
      filter: (event) => event.type === 'security_violation',
    },
    createDatadogSink({ apiKey: ddKey }),
  ],
})
Dead Letter Queue — When a sink fails after all retries, events go to a DLQ sink instead of being silently lost. Critical for compliance.
Streaming Audit Middleware — auditStreamMiddleware captures token usage and latency from streaming LLM calls. Previously, only complete() calls were audited.
Context Enrichment — Add global fields (environment, service name, version, region) to every event without repeating them at each call site:
const audit = createAuditTrail({
  context: { env: 'production', service: 'my-ai-service', version: '0.9.0' },
})
Async Dispose — dispose() now properly awaits pending storage writes and sink delivery before returning. Previously, events could be lost on shutdown.
The Big Picture
ElsiumAI is built on three pillars: Reliability, Governance, and Reproducibility.
This release strengthens all three:
| Pillar | What’s new |
|---|---|
| Reliability | AI Proxy with budget enforcement and caching |
| Governance | Audit sinks, DLQ, per-sink filtering, streaming audit, context enrichment |
| Reproducibility | Eval datasets, baseline comparison, regression detection in CI |
Plus two capabilities that make the whole system more accessible: Structured extraction for the most common LLM use case, and Dev Studio for understanding what your system is actually doing.
Getting Started
npm install elsium-ai@0.9.0Or try the proxy with zero commitment:
npx elsium proxy --port 4000
# Point any app to http://localhost:4000/v1
Or scaffold a new project:
npx elsium init my-ai-app
cd my-ai-app
npx elsium dev      # Terminal 1
npx elsium studio   # Terminal 2
Full documentation: github.com/elsium-ai/elsium-ai
ElsiumAI is MIT licensed and open source. Created by Eric Utrera (@ebutrera9103).
Eric Utrera
Creator of ElsiumAI. Building production AI infrastructure.